How do your completed energy projects impact your savings performance?
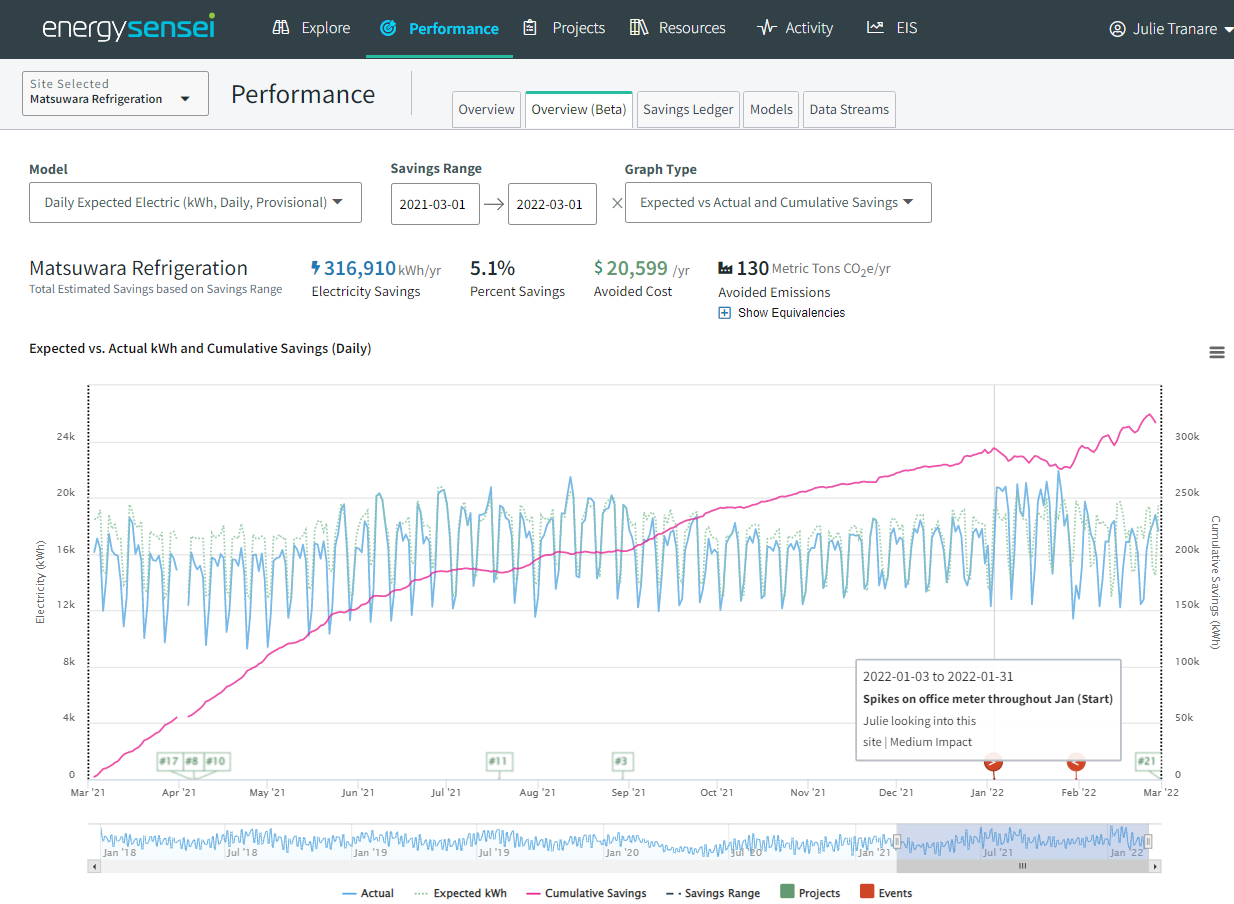
With the Performance Overview (Beta) release, you can view savings trends, completed projects, and events – all in one place! The cumulative savings graph automatically displays when a site energy model is created and makes it easier to onboard a site and identify actions impacting savings.

Overview (Beta) cumulative savings view
Reach out if you’d like to learn about how Energy Sensei can help you connect actions to energy efficiency.

